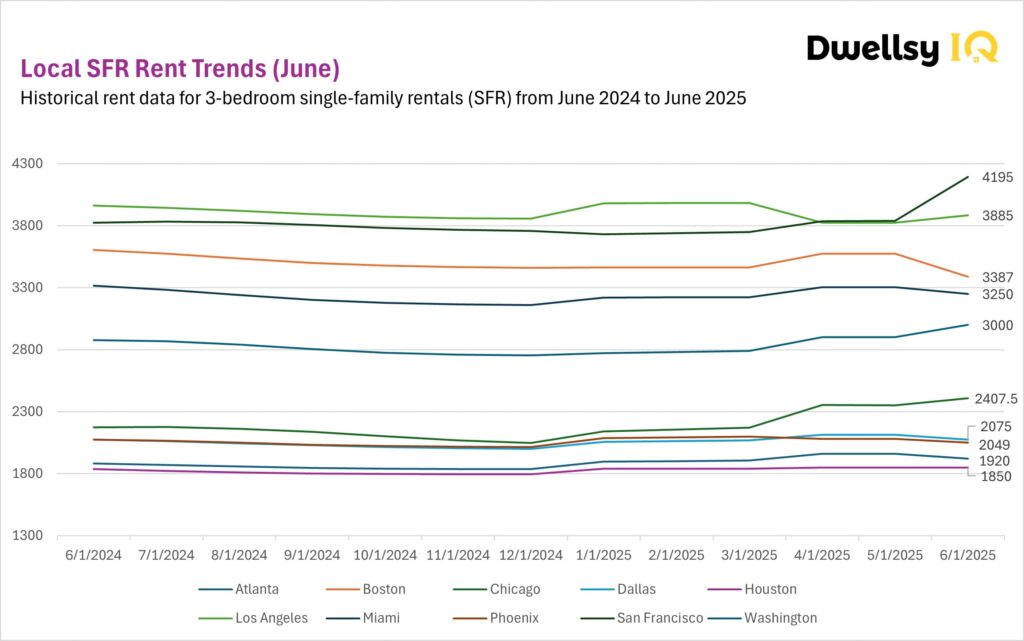
In this analysis, we examine rent trends for 3-bedroom SFRs across 10 major metros in the U.S. rental market. Based on verified data from millions of active listings on the Dwellsy Marketplace between June 2024 and June 2025.
Methodology
This report analyzes trends in the U.S. single-family rental (SFR) market, focusing on three-bedroom homes across 10 major metro areas. This report analyzes three-bedroom single-family rentals (SFRs) across 10 major U.S. metros, based on over 16 million verified listings. Data is cleaned to remove duplicates, errors, and outliers, then tracked month-over-month and year-over-year to show both seasonal and long-term trends. Figures are released as preliminary and may shift slightly, as final numbers are confirmed about two months later to ensure accuracy. See full methodology here.
June 2025 delivered a picture for the U.S. rental market, particularly for 3-bedroom single-family rentals (SFRs). According to the latest housing data, some metros reached new highs while others showed signs of softening. This divergence in rent data underscores how different economic conditions, affordability pressures, supply constraints and other factors are shaping local markets.
Main Takeaways
The June 2025 rental data highlight a clear divergence across major metros:
- Strong Growth Markets: San Francisco (+9.7% YoY), Chicago (+10.7% YoY), and Washington (+4.3% YoY) continued to climb, which might be caused by strong demand and limited housing supply.
- Softening Markets: Boston (-6.0% YoY), Miami (-2.0% YoY), and Phoenix (-1.2% YoY) declined, which might reflect affordability challenges and cooling demand in the housing data.
- Stable Markets: Houston and Dallas remained steady, while Atlanta posted modest annual gains (+2.1% YoY).
Overall, the surge recorded in April and May transitioned into a more fragmented landscape in June, as some metros strengthened while others weakened.
High-Cost Metros: San Francisco, Los Angeles, Boston
The nation’s most expensive metros showed sharp contrasts in the June rent data. San Francisco stood out with a 9.3% MoM increase, pushing rents to $4,195, its highest level this year and 9.7% higher YoY. This trend might signal sustained pressure in a tight market. Los Angeles stayed nearly flat at $3,885, up 1.6% MoM but 2.0% lower YoY, suggesting stabilization at a high plateau. Boston, however, fell sharply to $3,387, down 5.3% MoM, marking a sharp 6% YoY decline.
Mid-High Metros: Washington, D.C. and Miami
Washington, D.C. advanced to $3,000, reflecting a 3.4% MoM rise and a 4.3% YoY increase. The steady climb highlights Washington’s resilience, with demand that might be supported by a stable economic base. Miami, on the other hand, slipped to $3,250, down 1.6% MoM and 2.0% YoY. The decline in Miami’s rental data suggests affordability constraints are curbing further growth.
Mid-Tier Metros: Chicago, Dallas, Phoenix
Chicago emerged as one of the strongest markets in the June housing data. Rents climbed to $2,407, up 2.4% MoM and 10.7% YoY, highlighting what might be an ongoing pressure in family-sized rental supply. Dallas declined slightly to $2,075, down 1.8% MoM but essentially flat YoY. Phoenix also softened, with rents falling to $2,049, a 1.5% MoM decline and 1.2% lower than a year ago, reflecting cooling demand after years of rapid growth.
Affordable Metros: Atlanta and Houston
The most affordable markets in the dataset. Atlanta and Houston, remained comparatively stable. Atlanta recorded $1,920, down 2.0% MoM but still 2.1% higher YoY. Houston edged up to $1,850, a 0.1% MoM increase and 0.8% YoY rise. These cities illustrate the steadiness of affordable segments in the rent data, where fluctuations are narrower compared to higher-cost metros.
Conclusion
The June 2025 housing data reveal a fragmented SFR market. While metros like San Francisco, Chicago, and Washington showed continued momentum, others such as Boston, Miami, and Phoenix softened. Stable performance in Atlanta, Houston, and Dallas underscores how local dynamics shape outcomes differently across the country.
FAQ
What does the June 2025 housing data show about the U.S. rental market?
The June 2025 housing data shows a fragmented picture across major metros. Some markets like San Francisco, Chicago, and Washington experienced strong growth, while Boston, Miami, and Phoenix declined. Houston, Dallas, and Atlanta remained relatively stable in the rental data.
Which cities saw the highest rent increases in June 2025?
According to the latest rent data, the strongest rent increases were in San Francisco, Washington, and Chicago ). These metros show how demand and supply constraints continue to push rents higher in certain parts of the U.S.
Which cities experienced rent declines in June 2025?
The rental data shows that Boston, Miami, and Phoenix recorded month-over-month declines. These decreases might indicate affordability challenges and easing demand in those markets.
How can housing data help understand rental market trends?
Housing data provides transparency into rent levels, vacancy trends, and affordability pressures. By comparing rental data across metros, it becomes clear which markets are accelerating, which are cooling, and where stability dominates.
Where can I buy housing data or rental data?
Reliable housing data can be purchased from specialized providers that aggregate listings and rental market information. Companies like Dwellsy offer access to rent data for single-family rentals (SFRs) for proptech firms, universities, data companies, geospatial businesses, and hedge funds. These datasets typically include historical trends, type of property, and a range of other data points, helping investors, researchers, and analysts make informed decisions.