The housing market is the heartbeat of the economy, representing the system through which residential real estate is supplied, demanded, priced, and transacted. Because housing is both a basic human necessity and a major investment asset, its performance directly impacts household wealth and national financial stability.
What Is the Housing Market?
The housing market refers to the collective transactions of residential property within a specific geographic area. It is not a single, monolithic entity but rather a network of local and regional markets. While national trends provide a “big picture” view, median home price and home price appreciation are ultimately dictated at the city or neighborhood level.
This market is divided into two primary sectors:
- The For-Sale Market: Driven by for-sale inventory like single-family homes and condominiums.
- The Rental Market: Driven by rental inventory such as multifamily apartments and single-family rentals (SFRs).
How the Housing Market Works: Supply vs. Demand
At its core, the housing market operates on the economic principle of housing supply and housing demand.
1. Housing Supply and Elasticity
Supply includes new construction, existing homes, and vacant units. While supply is generally “inelastic” (it cannot be created instantly), supply elasticity varies significantly by region.
- Land-constrained metros (e.g., coastal cities like New York or San Francisco) remain permanently inelastic due to geography and strict regulation.
- Sprawl-friendly metros (e.g., Dallas or Atlanta) can adjust supply more rapidly over a 24-month horizon. Sudden disruptions, known as a supply shock, can cause extreme market volatility.
2. Housing Demand
Demand is driven by demographics, mortgage rates, and the availability of affordable housing. When demand shifts rapidly, it creates imbalances that lead to a boom-and-bust cycle.
3. Price Discovery
When demand outpaces supply, competition increases and prices rise. The process where buyers and sellers signal their willingness to pay is known as price discovery.
Key Metrics: Inventory, Vacancy, and Affordability
To measure the health of a housing market, analysts look at several “vital signs” that indicate whether a market is leaning toward buyers or sellers.
Inventory and Absorption
- Active Listings: The number of homes currently on the market.
- Days on Market (DOM): A leading indicator of price velocity—when DOM shrinks, it signals that price discovery is shifting in favor of the seller.
- Absorption Rate: The rate at which available homes are sold in a specific period.
- Months of Supply: A calculation of how long it would take to sell all current inventory at the current sales pace. (e.g., 6 months is generally considered a “balanced” market).
- The Shadow Market: Properties that are vacant or withheld from listing but could hit the market at any time.
Occupancy vs. Vacancy
In the rental sector, efficiency is measured by comparing building performance against the Natural Vacancy Rate (the structural vacancy expected in a healthy market):
- Physical Occupancy: The percentage of units with residents.
- Economic Occupancy: The actual rent collected vs. the potential total rent. (High physical occupancy can hide low economic occupancy if landlords are offering heavy discounts).
- Vacancy & Economic Vacancy: While vacancy refers to empty units, economic vacancy accounts for uncollected rent due to concessions or non-payment.
Rental Performance Metrics
Investors track rent growth and Net Effective Rent—which is the true income after subtracting concessions (like “one month free”). They also monitor loss to lease, the difference between current market rates and what “locked-in” tenants are currently paying.
Affordability and Liquidity
Affordability is the relationship between home prices, interest rates, and household income. When affordability drops, market liquidity (the ease of buying and selling) often deteriorates because fewer people can participate in the market.
The Housing Market Cycle
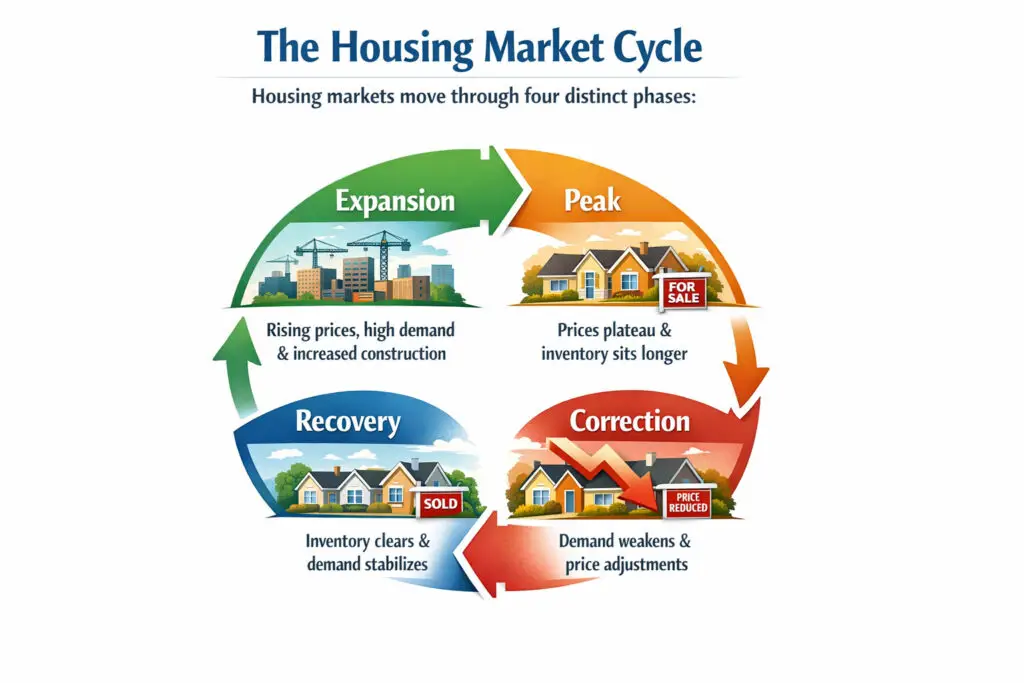
Housing markets are naturally cyclical, typically moving through four distinct phases:
- Expansion: Rising prices, high demand, and increased construction.
- Peak: Prices plateau and inventory begins to sit longer.
- Correction (Hypersupply): Demand weakens, and price adjustments occur to restore balance.
- Recovery: Inventory is cleared, and demand begins to stabilize.
Why the Housing Market Matters for Decision-Making
Understanding these dynamics allows various stakeholders to make informed choices:
- For Homeowners & Buyers: Helps determine the best time to sell or the right price to offer based on absorption rates.
- For Investors & Developers: Uses vacancy trends and rent growth to calculate potential Returns on Investment (ROI).
- For Policymakers: Tracks affordability and construction starts to inform housing policy and interest rate adjustments.
Data Sources for Market Intelligence
For real-time updates, professionals rely on platforms like Dwellsy IQ, LoopNet, CoStar, and Crexi to track shifts in inventory and pricing. These platforms are often considered among the best real estate data providers for tracking shifts in inventory and pricing.
FAQ
1. What is the difference between a buyer’s market and a seller’s market?
In a seller’s market, demand exceeds supply (housing inventory is low), giving sellers the leverage to demand higher prices. In a buyer’s market, the supply of homes exceeds demand, leading to more negotiations, slower absorption rates, and lower prices.
2. Why do home prices stay high even when interest rates rise?
This is often due to a supply squeeze. Many homeowners with low “locked-in” mortgage rates are reluctant to sell, keeping active listings at historic lows. When supply remains lower than the reduced demand, prices stay stubbornly high.
3. How do I calculate the “Months of Supply”?
To find the months of supply, divide the total number of active listings by the number of closed sales in the last month. For example, if there are 600 homes for sale and 100 sold last month, you have 6 months of supply—typically considered a balanced market.
4. What is the “Shadow Market” in real estate?
The shadow market refers to properties that are potentially available but not currently listed on a public MLS. This includes homes in foreclosure, investor-held properties being withheld for better pricing, or “pocket listings” sold privately.
5. What is the difference between Physical and Economic Occupancy?
Physical occupancy is simply the percentage of units that have people living in them. Economic occupancy is the percentage of potential rental income actually collected. A building can be 100% physically full but have low economic occupancy if tenants are not paying or if the landlord offered “free rent” concessions to fill units.
6. What causes a “Supply Shock” in housing?
A supply shock is a sudden event that drastically changes the number of available homes. This can be caused by natural disasters, sudden changes in government zoning laws, or a spike in construction costs that causes developers to halt new projects mid-build.