- New York City remains the most expensive rental market, with apartments averaging $3,545.
- Houston and Phoenix are the most affordable major metros, with rents at $1,078 and $1,192, respectively.
- New York City posted the highest annual rent growth, rising 10.8% YoY—the largest increase across all major U.S. cities.
- Miami recorded one of the steepest annual declines, falling 4.2% YoY as the market continues to correct.
The latest October 2025 rental data shows how much it now costs to rent a 1-bedroom apartment across the top U.S. cities, and the answer varies. New York City delivered the highest annual increase at +10.8% YoY, while Miami posted a significant -4.2% decline. At the same time, Atlanta and Chicago are experiencing healthy steady growth, and San Francisco is climbing again after last year’s slowdown. As some cities cool and others accelerate, this report explains where rents are highest and where they’re lowest.
Methodology
This report analyzes rent trends across major U.S. metros, grouped into three categories: high-cost markets such as New York City, San Francisco, Los Angeles, and Boston; mid-tier metros like Washington, D.C., Miami, and Chicago; and affordable metros such as Atlanta, Dallas, Houston, and Phoenix. The analysis draws on more than 16 million verified listings, cleaned to remove duplicates, outliers, and errors, and tracked month-over-month and year-over-year to capture both immediate changes and long-term patterns. All figures are preliminary and may adjust slightly once final numbers are confirmed approximately two months after publication. See full methodology here.
High-Cost Metros: New York City, Boston, San Francisco, and Los Angeles
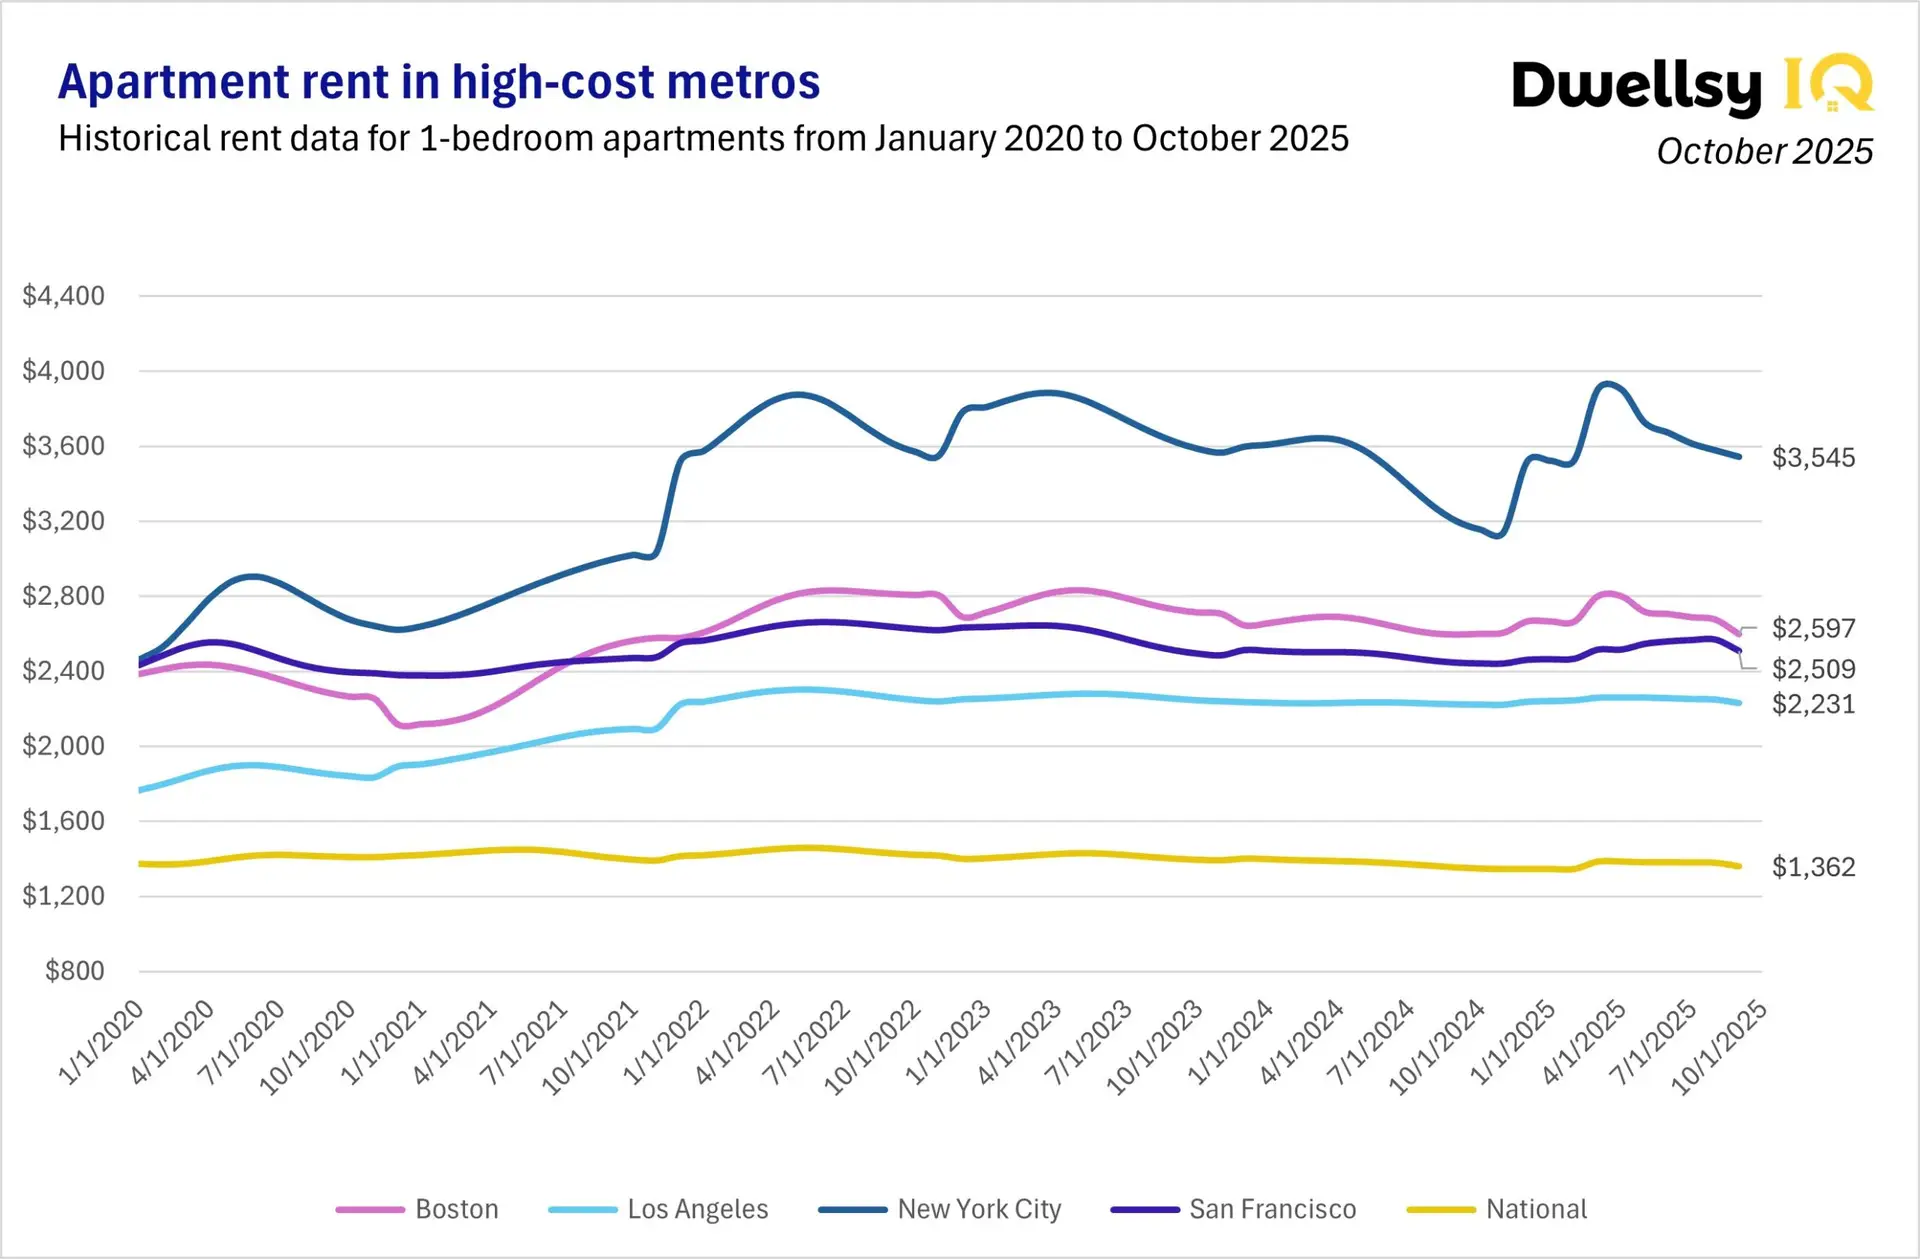
Rent Price in New York City
New York City remains the most expensive metro in the country. Renting an apartment in New York City averaged $3,545 in October, rising 1.0% MoM and a remarkable 10.8% YoY — the highest annual gain across all metros.
Rent Price in Boston
Boston averaged $2,597, with rents increasing 3.0% MoM and 0.1% YoY. As the second most expensive metro in this report, Boston remains a premium rental market, yet it is still nearly $1,000 cheaper than New York City, highlighting just how far NYC sits above every other U.S. metro in pricing.
Rent Price in San Francisco
In San Francisco, apartments averaged $2,509, reflecting a solid 2.4% MoM increase and 2.6% YoY growth.
Rent Price in Los Angeles
Los Angeles apartment rents averaged $2,231, rising 0.8% MoM and 0.3% YoY.
Mid-Tier: Washington, D.C.,Miami, and Chicago
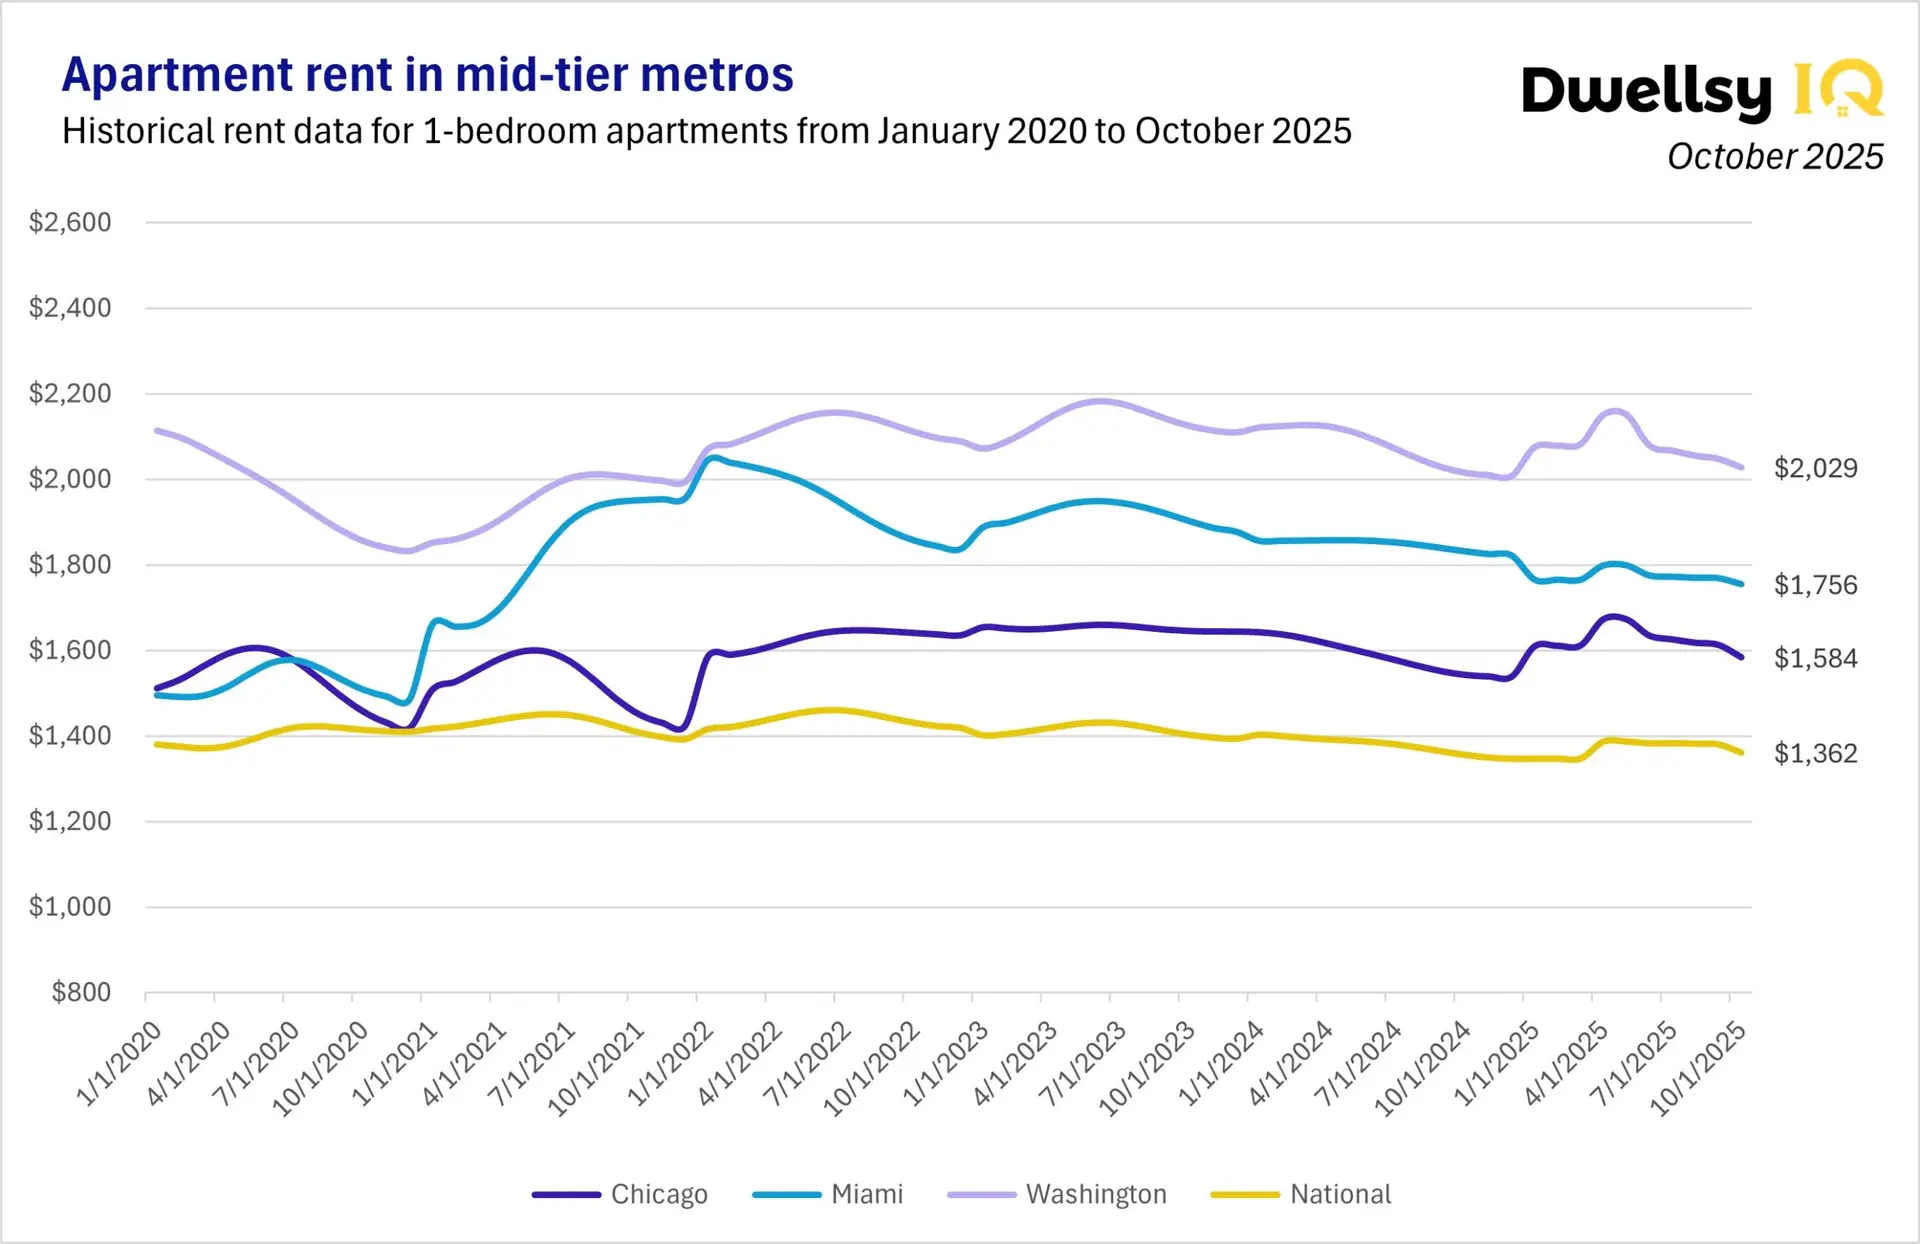
Rent Price in Washington, D.C.
Renting an apartment in Washington averaged $2,029, increasing 1.0% MoM and 0.6% YoY. The market remains steady with slow but consistent growth.
Rent Price in Miami
Miami’s apartment rent averaged $1,756, rising 0.8% MoM but declining 4.2% YoY, showing that the metro continues to normalize after years of rapid appreciation.
Rent Price in Chicago
Chicago’s apartment rent averaged $1,584, increasing 1.8% MoM and 2.7% YoY. The metro remains one of the highest performers outside the coastal markets.
Affordable Metros: Atlanta, Dallas, Houston, Phoenix
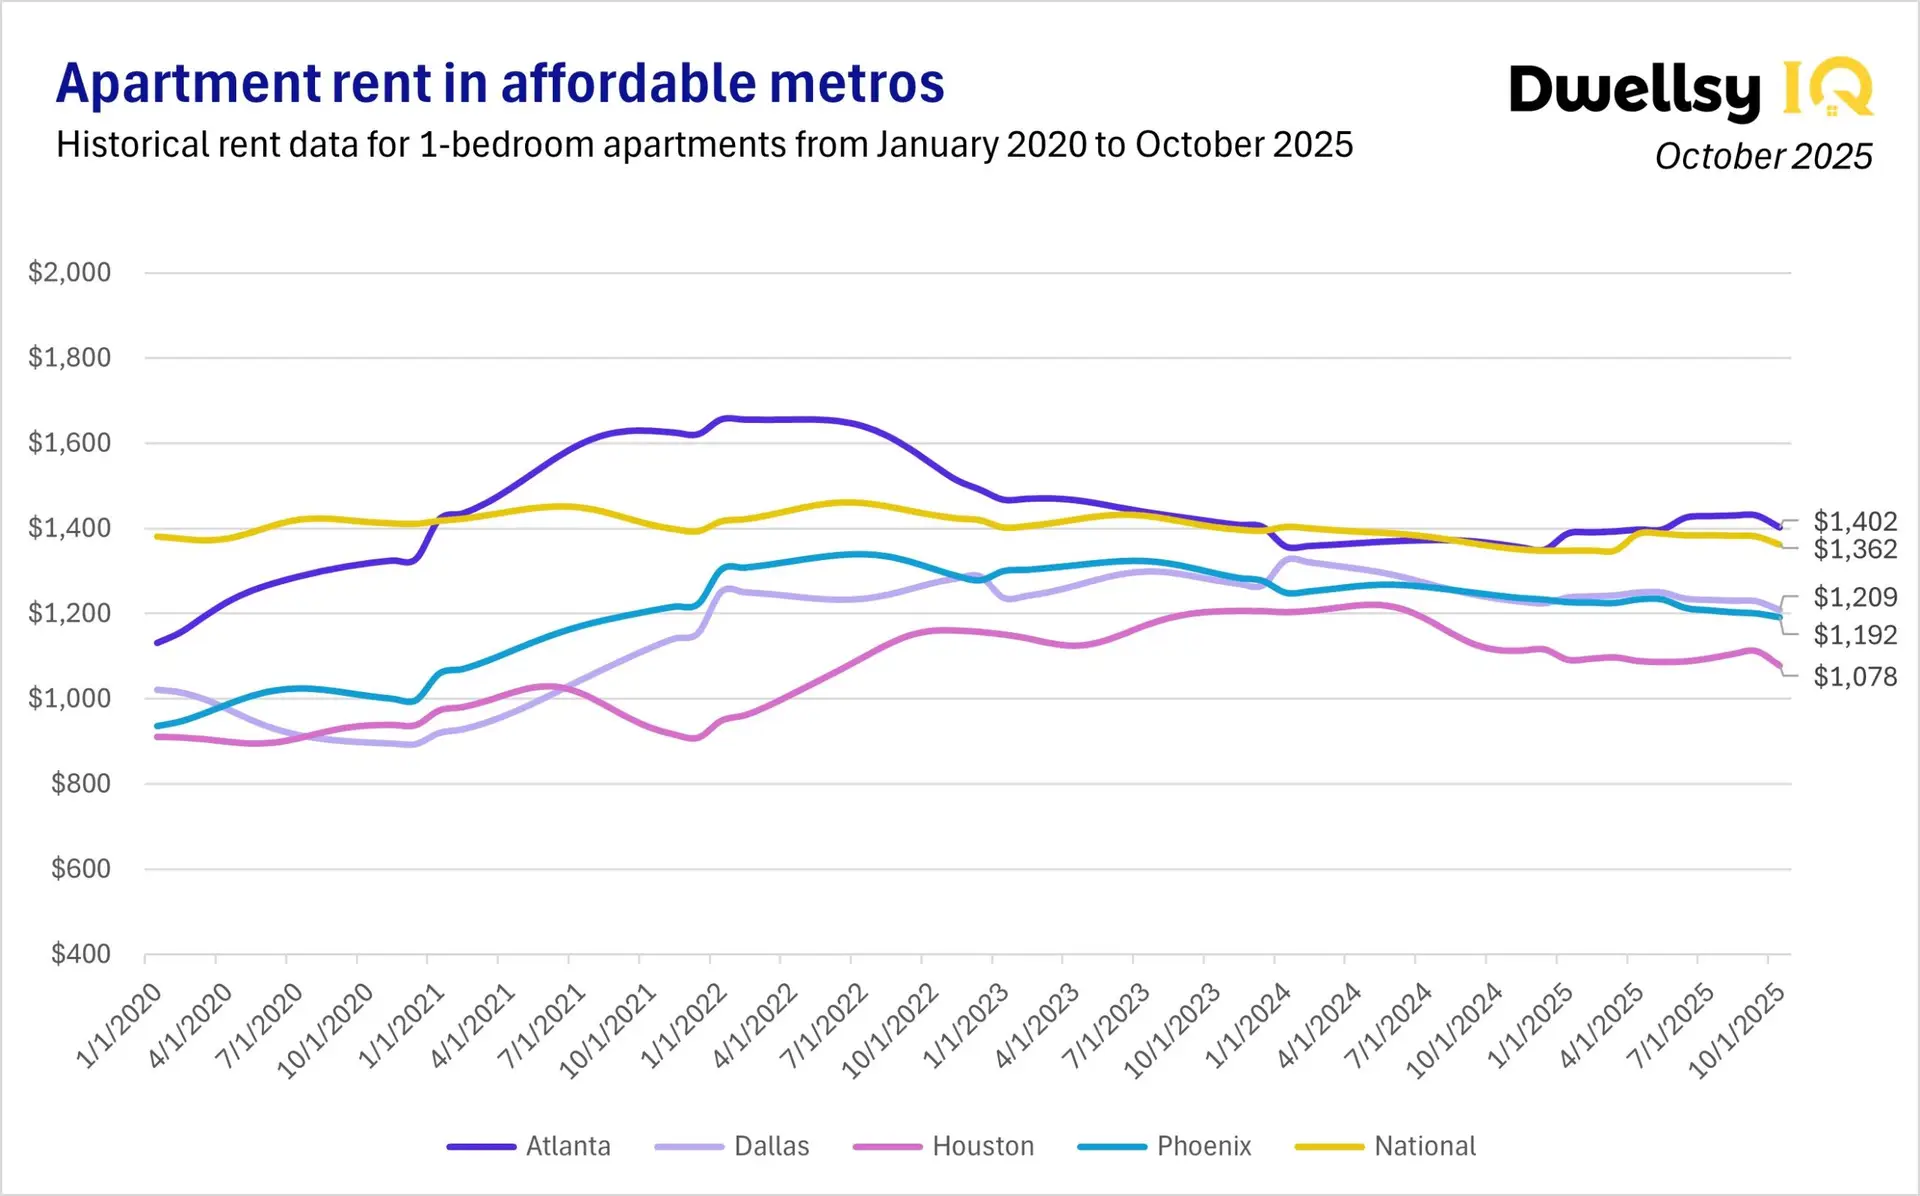
Rent Price in Atlanta
Atlanta’s apartment rent averaged $1,402, with rents rising 2.0% MoM and 2.8% YoY, a strong growth for an affordable metro.
Rent Price in Dallas
Dallas’s apartment rent averaged $1,209, rising 1.7% MoM but decreasing 2.2% YoY.
Rent Price in Phoenix
Renting an apartment in Phoenix averaged $1,192, increasing 0.8% MoM but falling 4.1% YoY. The metro continues to soften due to new inventory and slower in-migration.
Rent Price in Houston
Houston averaged $1,078, rising 3.2% MoM — the highest monthly increase among all metros— yet decreasing 3.3% YoY.
Conclusion
In October 2025, 1-bedroom apartment rents across major U.S. cities ranged from $1,078 in Houston to $3,545 in New York City. The national market grew 1.4% MoM and 0.4% YoY, reflecting cautious but steady recovery.
The landscape remains highly segmented:
- Strong growth: New York City, Chicago, Washington, Atlanta, and San Francisco
- Stabilizing: Los Angeles, Dallas, Boston
- Correcting: Miami, Phoenix, Houston
As the market moves into 2026, the divergence between rebounding metros and cooling Sun Belt markets may widen, offering clearer signals for investors, property managers, and analysts evaluating risk and opportunity across regions.
FAQ
What does the October 2025 rental data show about the U.S. market?
The market is fragmented. New York City leads with strong annual gains, while Miami, Phoenix, and Houston continue to correct. Midwestern and Northeastern metros show steady growth.
Which cities saw the highest rent increases in October 2025?
New York City (+10.8% YoY), Atlanta (+2.8% YoY), Chicago (+2.7% YoY), and San Francisco (+2.6% YoY).
Which cities experienced rent declines in October 2025?
Miami (–4.2% YoY), Phoenix (–4.1% YoY), Houston (–3.3% YoY), and Dallas (–2.2% YoY).
How can rental market data help understand housing trends?
Rental data reveals where demand is strengthening or cooling, highlights affordability pressures, and exposes long-term patterns across metros, supporting more accurate decisions for investors, property managers, policy leaders, and analysts.
Where can I buy rental market data?
Companies like Dwellsy provide rental datasets, including historical trends, rent benchmarks, and metro-level insights used by institutional investors, proptech platforms, universities, and government agencies.