In this analysis, we examine rent trends for one-bedroom apartments across 10 major metros in the U.S. rental market. Based on verified data from millions of active listings on the Dwellsy Marketplace between May 2024 and May 2025.
Methodology
This report analyzes one-bedroom rental trends in the U.S. multifamily market from May 2024 to May 2025, based on over 16 million vetted Dwellsy listings. We used Gaussian filtering to smooth outliers and tracked month-over-month and year-over-year changes to reveal seasonal and long-term shifts. All insights are drawn from real-time listing data. For visual clarity, chart axes were scaled by subtracting ~500 from the minimum value and adding ~500 to the maximum. See full methodology here.
Atlanta
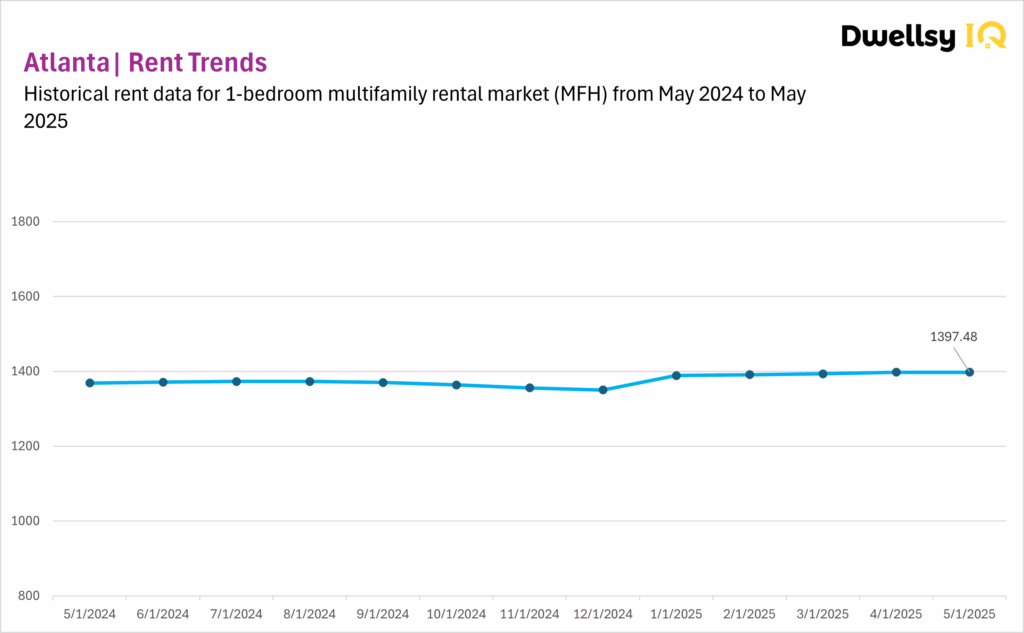
Atlanta’s multifamily market held steady in May 2025, following four months of consistent gains. While month-over-month growth paused at 0.00%, this flat reading might be a momentary plateau rather than a reversal. After a prolonged correction and a clear rebound in early 2025—especially April’s +2.3% surge—the May figure likely might be a brief seasonal or affordability pause within a broader recovery arc.
While the pace of growth has slowed compared to peak pandemic periods, the underlying trend remains positive. If upward momentum resumes in the coming months, it will add weight to the idea that Atlanta has reached a post-correction turning point and is beginning to chart a more sustainable growth path.
Chicago
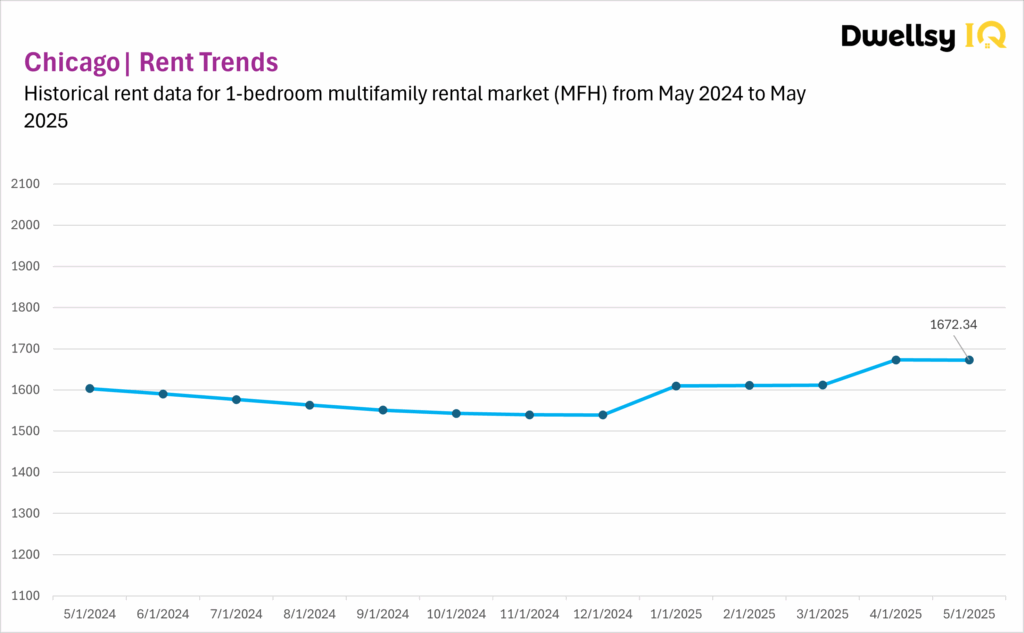
Chicago’s multifamily market flattened in May 2025, with a slight -0.02% dip following April’s sharp +3.8% gain. This modest decline likely signals a temporary stall after a spring rebound rather than the start of a new downturn. The market’s long-standing seasonal rhythm—climbs in spring, softening into fall—has resumed after a year of disruption in 2024. May’s pause appears consistent with that pattern, especially after April’s outsized jump, which might have front-loaded some seasonal gains.
Year-over-year, rents are up 4.3%, showing improvement from last year’s extended correction. This annual growth suggests that Chicago’s recovery is underway, even if uneven. If momentum resumes in June or July, it would further reinforce that the market is realigning with its pre-2024 seasonal cadence.
Dallas
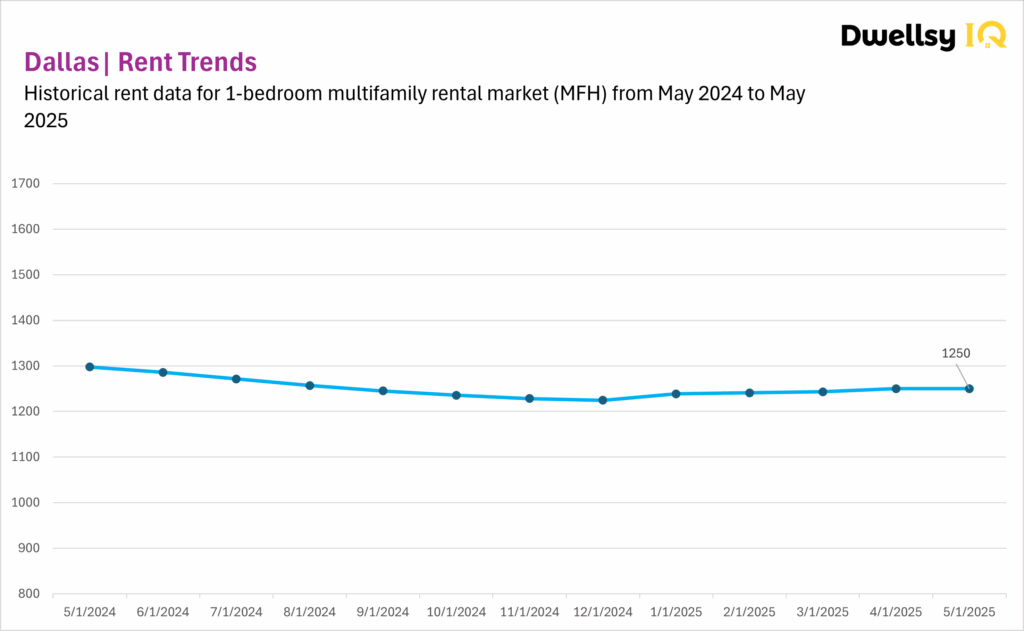
Dallas’ multifamily market showed no change in May 2025, with rent holding steady at $1,250 after four months of modest gains. This flat reading closely follows a slight dip in April and suggests the early 2025 recovery MIGHT be losing steam. The stall aligns with the broader five-year pattern of brief rebounds followed by stagnation, reinforcing the idea that the market is caught in a holding pattern rather than on a steady upward trajectory.
Year-over-year, rents remain 3.7% lower than May 2024, indicating that Dallas has yet to recover from last year’s correction. While early 2025 offered signs of improvement, the lack of growth in both April and May raises doubts about the strength and durability of that rebound.
Houston
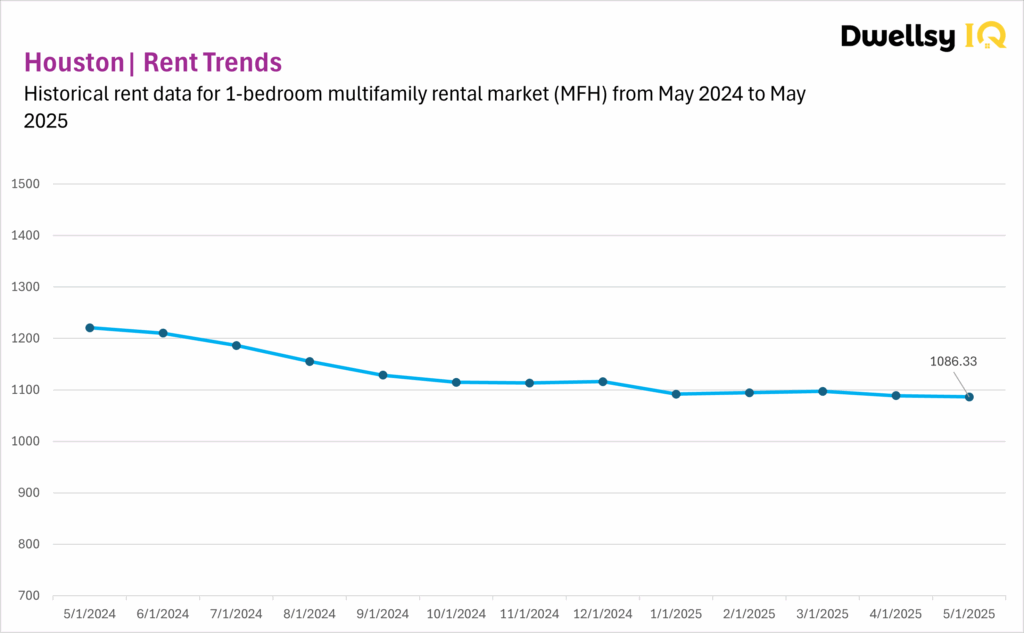
Houston’s multifamily market resumed its downward trend in May 2025, following a brief April spike that had offered a glimmer of hope for recovery. While April’s +9.4% jump hinted at possible seasonal demand or pricing resets, the -0.21% monthly dip marks a decline.
The -11.0% year-over-year decline—by far the steepest among major metros—further underscores the severity of Houston’s correction. This aligns with the five-period analysis, which described a market defined by volatility and recent extended losses. Overall, Houston might be entrenched in a persistent downturn, with little evidence that the April rebound marked the beginning of a true recovery.
Los Angeles
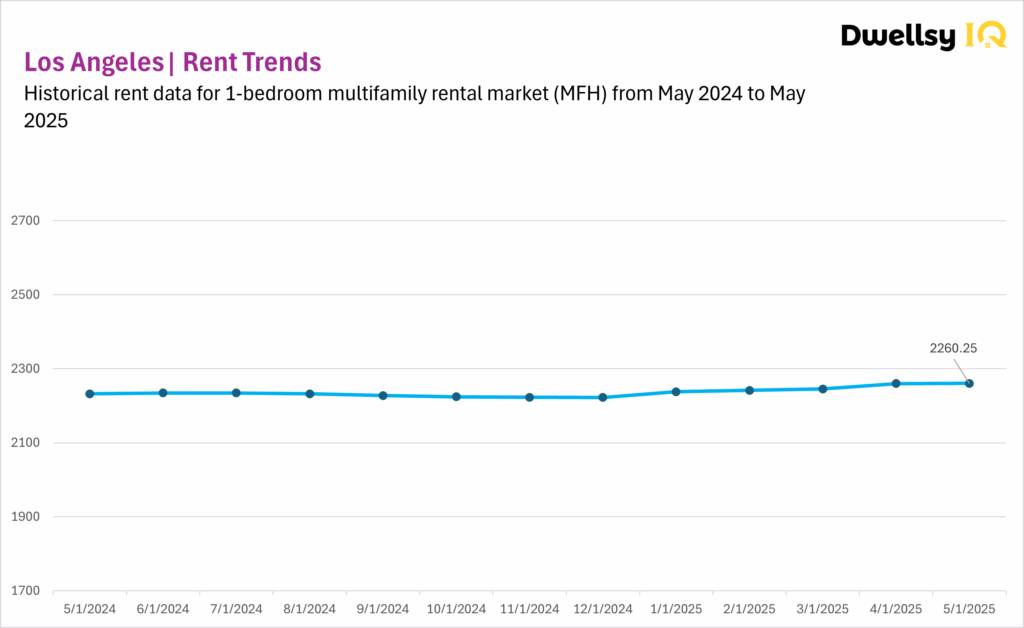
Los Angeles’ multifamily market continued its gentle upward trajectory in May 2025, extending its recovery streak to five consecutive months. This aligns with the five-year view of a market that surged early in the decade but has since transitioned into a plateau, with rents largely holding steady around the $2,260 mark since 2022.
The +1.3% YoY gain supports the idea of slow, stabilizing growth. While this marks progress from the flat readings of 2024, the lack of acceleration suggests demand remains tepid. The May data suggests that LA’s market is not volatile, but also no longer fast-moving. Whether this pause is a seasonal plateau or the start of a longer cooling phase remains to be seen.
Miami
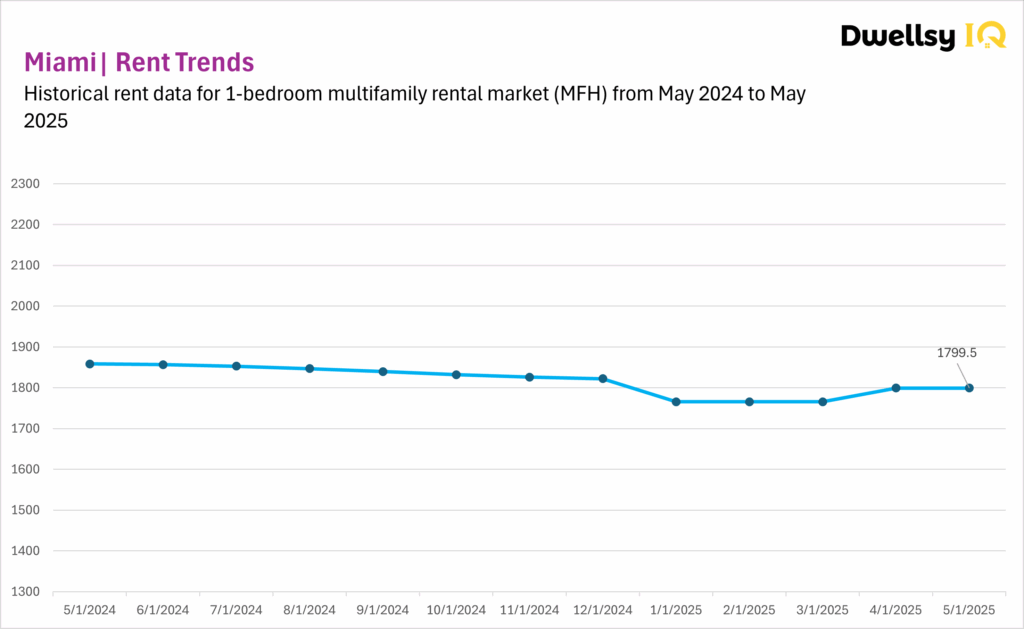
Miami’s multifamily market showed no growth in May 2025, holding flat after April’s +1.9% increase. While April’s rebound hinted at renewed strength, May’s result might be a signal that momentum is fragile and potentially constrained by affordability ceilings or soft demand. Rents remain well below peak levels, indicating that recovery, if underway, is still in its early and uncertain stages.
The -3.2% YoY change underscores the depth of the market’s contraction over the past year. While the recent stability might mark a floor, it has not yet translated into a true recovery trend. In line with the longer-term narrative, Miami appears to be in a wait-and-see phase, showing signs of bottoming out, but with no sustained upward pressure yet. June and July will be critical in determining whether the April uptick was a blip or the start of a seasonal rebound.
New York City
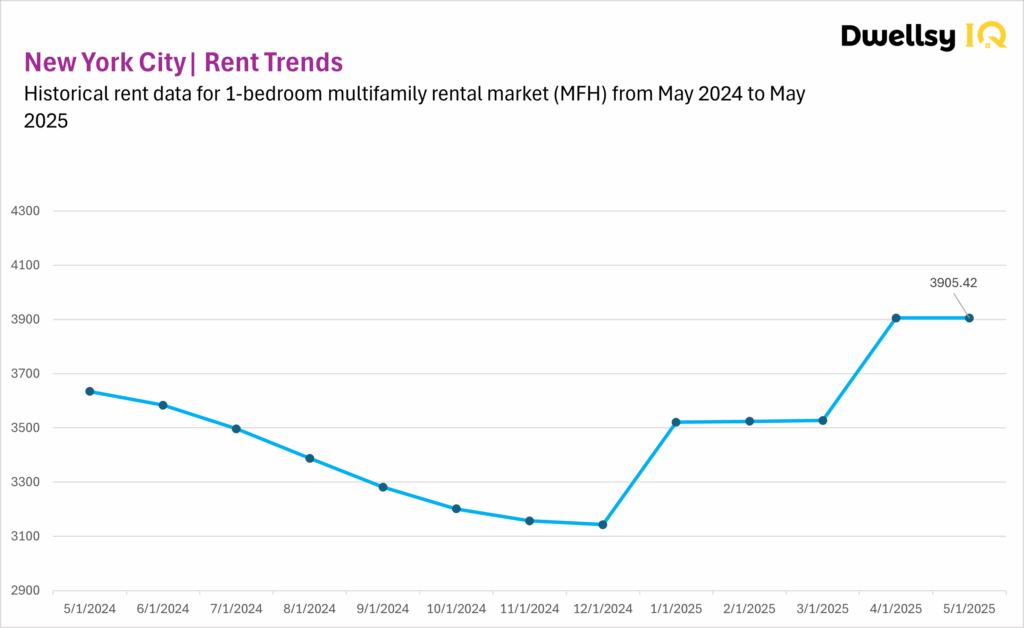
New York City’s multifamily rental market remained unchanged in May 2025, holding at the new record high reached after April’s massive +10.7% surge. This pause comes after a highly volatile start to the year, where January and April both delivered double-digit gains. The lack of growth in May might reflect a seasonal breather, temporary price ceiling, or normalization after aggressive price resets.
The +7.4% YoY growth highlights how far NYC has come since the downturn in 2024, with recent spikes more than offsetting last year’s losses. In line with the five-period analysis, this plateau might be part of NYC’s typical boom-and-bust cycle rather than a sign of weakness. Whether April was an outlier or the beginning of a new pricing tier remains to be seen, but for now, the market sits at historically high rent levels, with strong momentum behind it.
Phoenix
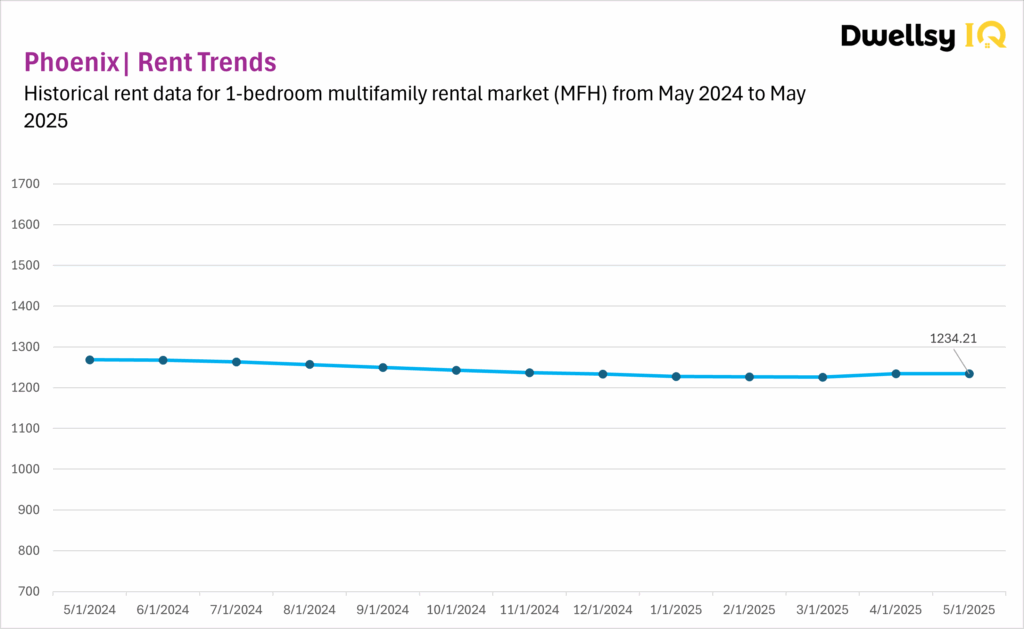
Phoenix’s multifamily rental market remained effectively flat in May 2025, with a negligible -0.01% dip following April’s +0.69% gain. This minimal movement reinforces the idea that the market might be approaching a bottom after nearly a year of steady declines, but it hasn’t yet shown the momentum needed for a clear recovery.
The -2.7% YoY decline underscores that Phoenix remains in a subdued phase, with rents still well below their 2022 peak. While April’s bump hinted at a potential shift, May’s stagnation might be a signal that any turnaround remains tentative. Consistent with the broader trend narrative, Phoenix appears to be hovering in a holding pattern, watching for demand or macro conditions to improve before meaningful growth can resume.
San Francisco
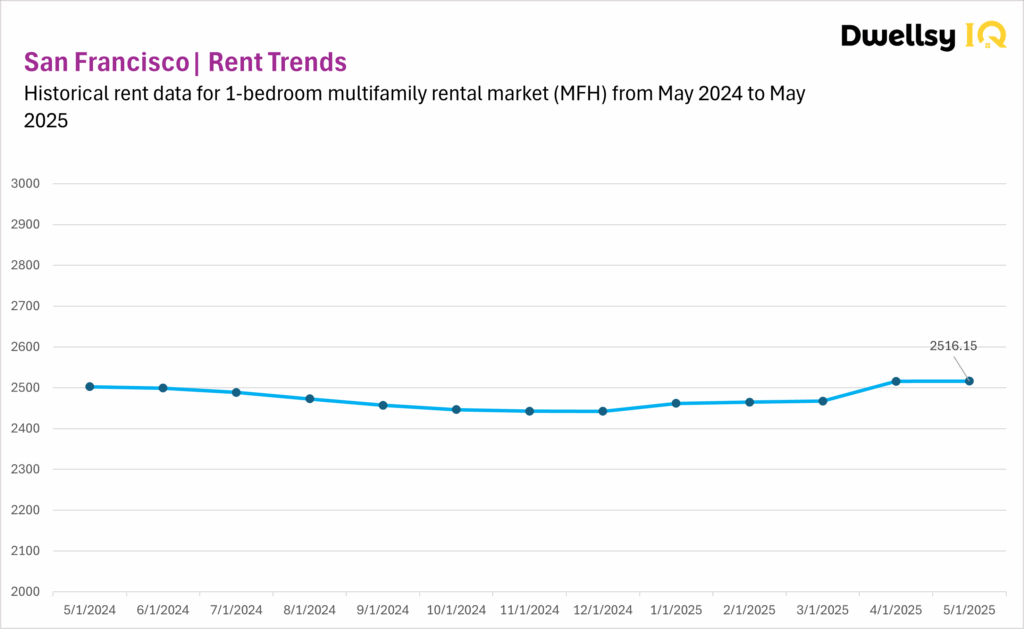
San Francisco’s multifamily market showed signs of life in early 2025 with consistent but small gains in Q1 and in April. However, May’s near-zero +0.01% MoM increase suggests that momentum might have already peaked.
The modest +0.5% YoY growth confirms that while rents are no longer falling, appreciation remains minimal. San Francisco’s rental landscape continues to reflect its mature, low-volatility profile, with pricing appearing to settle into a stable range. Rather than a sharp rebound, current patterns might be a cautious return to equilibrium.
Washington
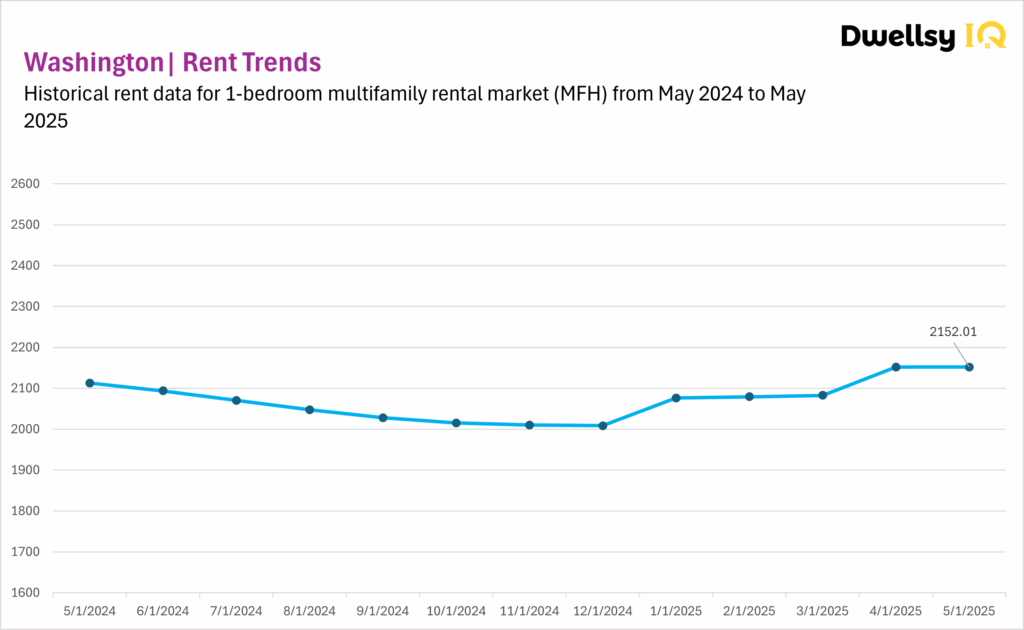
Washington’s rental market appears to be following its well-established seasonal rhythm in 2025, with a modest recovery unfolding after a prolonged decline in late 2023 and throughout 2024. The sharp +3.32% spike in April signaled a potential seasonal peak, and May’s flat reading (+0.00%) suggests the market might now be transitioning. This month’s result aligns with the metro’s historical behavior of spring acceleration followed by mid-year leveling off.
The +1.8% YoY gain reinforces Washington’s reputation for low volatility and gradual movements. While not dramatic, this annual growth points to a resilient market that might be gradually regaining strength after last year’s losses. The consistency between the short-term and long-term trends suggests that Washington is settling into a familiar pattern, with mild gains during peak leasing months, then a return to steadiness rather than surging growth.