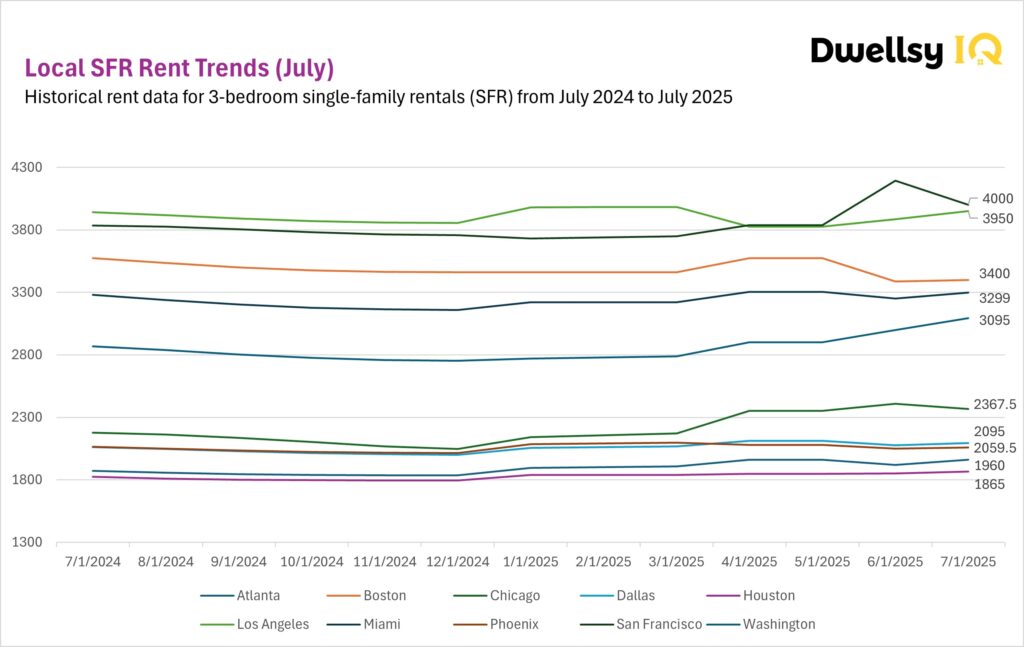
In this analysis, we examine rent trends for 3-bedroom SFRs across 10 major metros in the U.S. rental market. Based on verified data from millions of listings on the Dwellsy.com Marketplace between July 2024 and July 2025.
Methodology
This report analyzes trends in the U.S. single-family rental (SFR) market, focusing on three-bedroom homes across 10 major metro areas. This report analyzes three-bedroom single-family rentals (SFRs) across 10 major U.S. metros, based on over 16 million verified listings. Data is cleaned to remove duplicates, errors, and outliers, then tracked month-over-month and year-over-year to show both seasonal and long-term trends. Figures are released as preliminary and may shift slightly, as final numbers are confirmed about two months later to ensure accuracy. See full methodology here.
The July 2025 housing data for 3-bedroom single-family rentals (SFRs) shows a mixed landscape across U.S. metros. While some markets continued to post solid gains, others softened or corrected after strong performances earlier in the year. Compared to July 2024, most metros saw positive growth, but the pace and direction varied widely depending on local dynamics.
Main Takeaways
- Strong Growth Markets: Washington (+7.9% YoY), Chicago (+8.8% YoY), and Atlanta (+4.7% YoY) continued to climb, which might be driven by sustained demand and limited supply.
- Softening Markets: San Francisco (+4.3% YoY), Boston (–4.8% YoY), and Phoenix (–0.3% YoY) showed declines or corrections, suggesting affordability pressures and cooling demand.
- Stable Markets: Houston (+2.3% YoY), Dallas (+1.6% YoY), Los Angeles (+0.2% YoY), and Miami (+0.5% YoY) remained comparatively steady, with modest annual growth.
High-Cost Metros: San Francisco, Los Angeles, Boston
The high-cost segment showed clear divergence in July. San Francisco corrected sharply to $4,000, down –4.7% from June but still 4.3% above last year when compared to July 2024. Los Angeles remained steady at $3,950, up 1.7% MoM and almost flat YoY (+0.2%). Boston, in contrast, fell to $3,400, slipping –4.8% YoY, which might be a signal of a persistent cooling trend among the most expensive markets.
Mid-High Metros: Washington, D.C. and Miami
Washington, D.C. strengthened further in July, climbing to $3,095. This represented a 3.2% MoM increase and a 7.9% YoY gain, positioning it as one of the strongest performers in the dataset. Miami ended the month at $3,299, up 1.5% MoM but only 0.5% above last year, suggesting slower growth in South Florida compared to the capital.
Mid-Tier Metros: Chicago, Dallas, Phoenix
Chicago posted the largest annual increase across all metros, rising 8.8% YoY to $2,367.5. Although rents dipped –1.7% MoM in July, its year-over-year growth highlights what might be an ongoing demand pressure. Dallas remained stable at $2,095, up 1.0% MoM and 1.6% YoY, reflecting steady but unspectacular growth. Phoenix edged up slightly to $2,059.5, a 0.5% MoM increase but –0.3% below July 2024, what might indicate a cooling trend after years of rapid rent growth.
Affordable Metros: Atlanta and Houston
Atlanta continued its upward trajectory, reaching $1,960 in July, a 2.1% MoM rise and a 4.7% YoY gain, the strongest among the affordable metros. Houston, meanwhile, edged up to $1,865, recording a modest 0.8% MoM and 2.3% YoY increase. These two metros demonstrated the stability and gradual appreciation typical of more affordable markets.
Conclusion
The July 2025 rent data underscores the fragmented nature of the rental market. Washington and Chicago are leading in sustained growth, Atlanta continues to climb steadily, and San Francisco corrected after its June surge. Boston and Phoenix weakened further, while Los Angeles, Miami, Dallas, and Houston provided stability.
FAQ
What does the July 2025 SFR rental data show about the U.S. market?
The July 2025 single-family rental data shows a fragmented market. Washington, Chicago, and Atlanta continued to post strong growth, while Boston and Phoenix declined year-over-year. San Francisco corrected after June’s spike but still remained above July 2024 levels.
Which cities saw the highest rent increases in July 2025?
According to the latest SFR rental data, the strongest YoY increases were in Chicago (+8.8%), Washington (+7.9%), and Atlanta (+4.7%).
Which cities experienced rent declines in July 2025?
The single-family rental data shows that Boston (–4.8% YoY) and Phoenix (–0.3% YoY) recorded year-over-year declines. San Francisco also fell month-over-month (–4.7%) but remained +4.3% above July 2024.
How can SFR rental data help understand market trends?
SFR rental data provides insight into rent levels, seasonal patterns, and affordability shifts. By tracking single-family rental data across metros, analysts can see which markets are accelerating, which are cooling, and which remain stable.
Where can I buy single-family rental data?
Reliable SFR rental data can be purchased from specialized providers that aggregate verified listings and rental market information. Companies like Dwellsy offer access to single-family rental data for investors, proptech firms, universities, data companies, geospatial businesses, and hedge funds. These datasets typically include historical trends, comparable properties, current rent benchmarks, and a range of other data points.