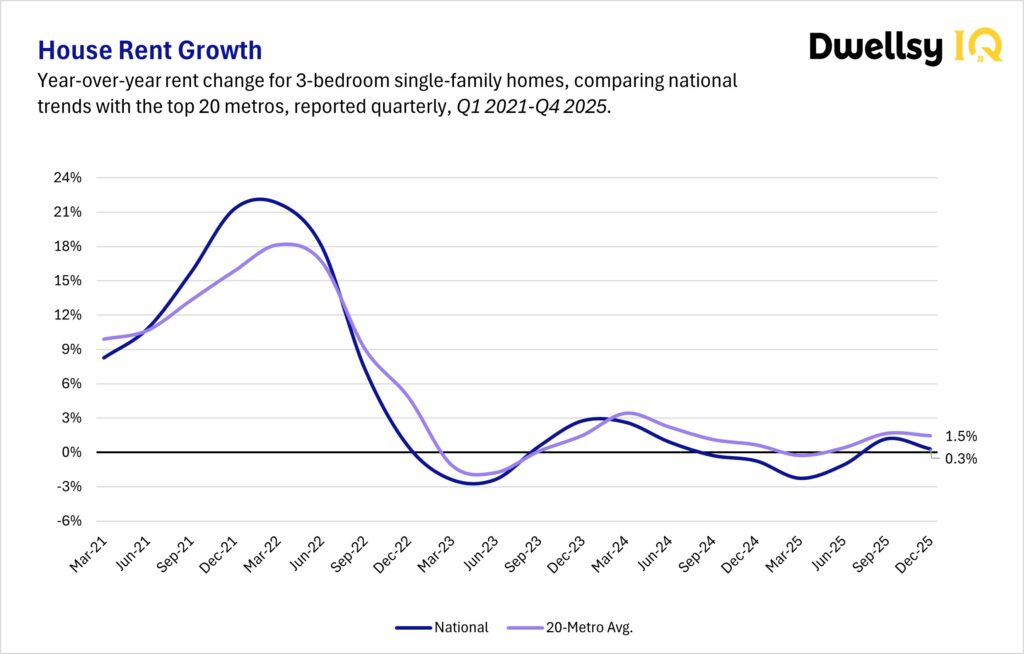
The 2026 Rental Housing Index, released by Dwellsy IQ, shows that U.S. house rents stabilized in 2025, with rents for three-bedroom single-family rental homes rising by 0.3% ($6) year over year to finish at $1,892 per month. The report, published in 2026, analyzes full-year 2025 rental housing data, providing a backward-looking view of how the market moved beyond the volatility of the early decade toward more balanced conditions.
The analysis is based on Dwellsy IQ rental data and was conducted by Jonas Bordo, CEO and cofounder of Dwellsy, together with Paul Briggs of Briggs Advisors, combining decades of experience in rental housing data, research, and market analysis.
Download the 2026 Rental Market Report
This article covers only part of the trends observed, as analyzed in the 2026 Rental Housing Index. Download the full report, reviewing rental market performance, for complete national and metro-level analysis across U.S. apartment markets.
U.S. House Rent Trends: Stabilization After Volatility
According to the 2026 Rental Housing Index, single-family rental (SFR) performance in 2025 reflected a market transitioning toward stability. After a minor contraction in 2024, rents for three-bedroom homes increased modestly during 2025, remaining just below the approximately $1,900 level recorded at the end of 2023.
The report notes that this modest increase follows a period of dramatic movement earlier in the decade. Between early 2021 and May 2022, rents for three-bedroom single-family rentals increased by $486, or more than 32%, before transitioning into a period characterized primarily by seasonal fluctuations rather than sustained growth.
Unlike apartments, where elevated new supply contributed to rent declines in many markets, the single-family sector experienced more limited supply pressure. High home prices and elevated mortgage rates continued to support demand for single-family rentals, keeping many households in the rental pool.
Why House Rents Stabilized?
House rents stabilized primarily because demand for single-family rentals remained supported by high home prices and elevated mortgage rates, which kept many households in the rental pool longer than in typical market cycles. At the same time, new supply in the single-family segment remained more limited than in the apartment sector, reducing downward pressure on rents and contributing to more stable pricing conditions across most markets.
Affordability constraints also played a significant role. Although household incomes have increased, higher overall living costs have limited tenants’ ability to absorb additional rent increases. As a result, landlords in many markets were unable to push through inflationary rent growth, leading to slower rent movement during both 2024 and 2025.
Single-family rents historically tend to experience fewer sharp declines and often grow faster than inflation over longer periods. However, this pattern did not hold during the most recent two-year period, as financially stretched households and higher operating costs limited the ability of landlords to meaningfully increase rents despite continued demand.
Market-Level Differences in House Rent Performance
While national house rent growth was modest, market-level performance varied significantly.
Among the top 20 metropolitan areas analyzed, Chicago recorded the strongest growth in single-family rents, approaching 10% year over year. New York, Washington, D.C., Philadelphia, and Riverside-San Bernardino followed, each posting growth of approximately 3% or more. These markets represented the fastest-growing U.S. cities for house rents in 2025, reflecting stronger local demand conditions and comparatively tighter supply.
At the opposite end of the spectrum, Denver recorded the weakest performance, followed by Boston and Phoenix, each showing negative rent growth of around 2%. These markets accounted for the largest house rent declines among major U.S. metros, highlighting areas where local supply conditions and affordability pressures weighed more heavily on rent performance.
National averages continue to mask substantial local variation, with rent outcomes shaped by differences in local supply pipelines, economic growth, and cost-of-living conditions.
FAQ
What is the 2026 Rental Housing Index?
The 2026 Rental Housing Index is a data-driven analysis released by Dwellsy IQ that examines rental price movements across the United States. Published in 2026, the index analyzes rental housing data from prior years to provide a backward-looking view of how the market moved beyond the volatility of the early 2020s toward more balanced conditions.
What does the 2026 Rental Housing Index show about U.S. house rents?
The index shows that U.S. house rents stabilized, with rents for three-bedroom houses rising modestly to an average of $1,892 per month. The data indicate that rent movement returned closer to typical seasonal patterns following the sharp increases seen earlier in the decade.
Why did house rents stabilize?
House rents stabilized primarily because demand remained supported by high home prices and elevated mortgage rates, which kept many households in the rental market longer. At the same time, new supply in the house rental segment remained more limited than in the apartment sector, while affordability constraints limited tenants’ ability to absorb significant rent increases.
How do recent house rent trends compare to earlier years?
House rents experienced rapid growth earlier in the decade before transitioning into a period of slower movement and stabilization. After a period of significant increases, rent trends began to reflect more typical seasonal fluctuations rather than sustained upward movement.
Did house rent performance vary by city?
Yes. Market-level performance varied significantly across metropolitan areas. Some cities, including Chicago, New York, Washington, D.C., Philadelphia, and Riverside-San Bernardino, recorded stronger rent growth, while markets such as Denver, Boston, and Phoenix experienced declines. Local supply conditions, affordability pressures, and economic factors contributed to these differences.
Why do national averages not reflect local rent conditions?
National averages provide a broad view of market direction but can mask significant variation between cities. Rent outcomes differ across metropolitan areas due to differences in local supply pipelines, economic growth, and cost-of-living conditions, which influence how rents move in each market.